
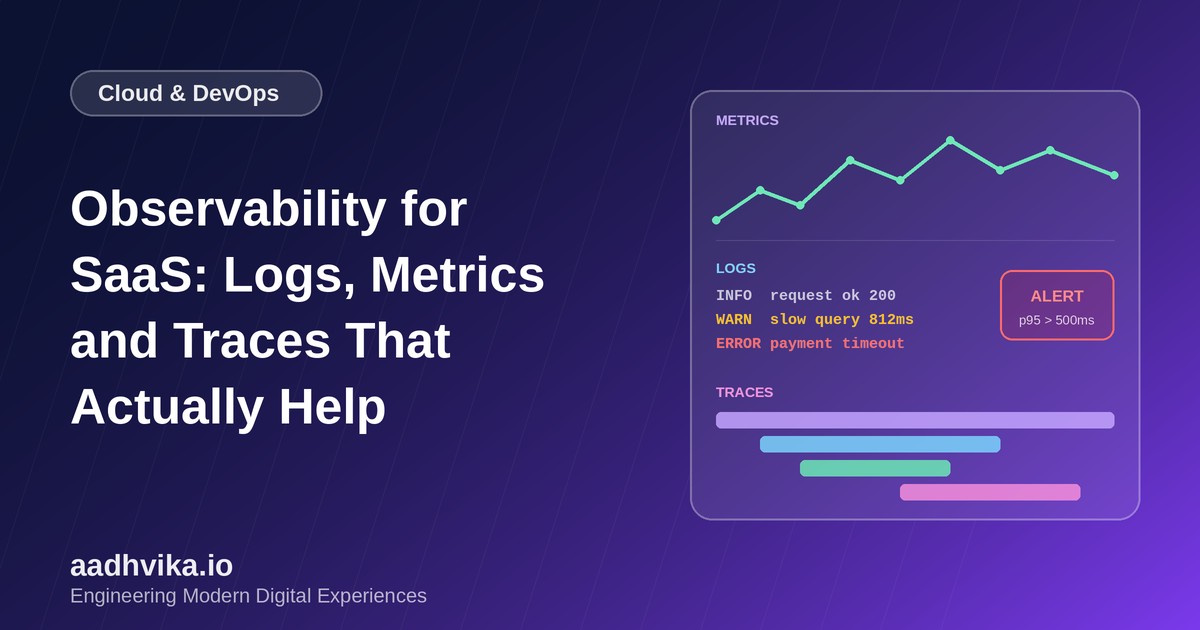
Every team eventually gets the call: something is slow, something is failing, and nobody knows why. Monitoring tells you that a problem exists. Observability tells you why. For a SaaS product with many customers, several services and constant releases, the difference decides whether an incident takes ten minutes or three hours.
Monitoring vs observability
Monitoring watches for known failure modes: CPU is high, the disk is full, the error rate crossed a threshold. Observability is the ability to ask new questions of a running system without shipping new code. It rests on three kinds of telemetry: logs, metrics and traces.
Logs: what happened
Logs are timestamped records of events. They are the most detailed source and the easiest to overwhelm yourself with.
- Use structured logs in JSON so you can filter by field rather than searching text.
- Include a request ID, tenant ID and user ID in every entry.
- Use levels sensibly: errors for failures that need action, warnings for surprises, info for key business events.
- Never log passwords, tokens or full card numbers.
Metrics: how much and how often
Metrics are numbers over time, cheap to store and fast to query. They are the best tool for dashboards and alerts. Start with the four golden signals from Google's site reliability practice:
- Latency: how long requests take, tracked at p50, p95 and p99 rather than only the average.
- Traffic: how many requests you serve.
- Errors: the share of requests that fail.
- Saturation: how full your resources are, such as CPU, memory, connections and queue depth.
Traces: where the time went
A trace follows one request as it passes through your API, database, cache and third-party services. Each step is a span with a start time and duration. When a page is slow, a trace shows at a glance that 800 of the 900 milliseconds were spent in one database query. OpenTelemetry is the open standard for producing traces, metrics and logs, and it keeps you free to switch vendors later.
Connect the three
The real power comes from linking them. Put the trace ID in every log line. From an alert on a latency metric, jump to a slow trace, then to the logs for that exact request. That path from symptom to cause is what makes a system observable.
Alerts people trust
- Alert on symptoms customers feel, such as high error rates or slow responses, not on every internal blip.
- Every alert should have an owner and a runbook that says what to check first.
- Use service level objectives, for example 99.9 percent of requests succeed, and alert when you are burning through the error budget too fast.
- Remove alerts that nobody acts on. Alert fatigue is a real reliability risk.
Watch the cost
Telemetry can become one of your biggest cloud bills. Sample traces, set retention limits on logs, and avoid high-cardinality labels such as user IDs on metrics. Keep full detail for errors and slow requests and less for the healthy majority.
Conclusion
You do not need an expensive platform to start. Add structured logs, the four golden signals and OpenTelemetry tracing to your most important flow, link them with a shared ID, and build a few alerts you trust. Your on-call engineers will thank you.